. 2024 Jun;56(6):1147-1155.
doi: 10.1038/s41588-024-01755-1. Epub 2024 May 14.

Analysis of somatic mutations in whole blood from 200,618 individuals identifies pervasive positive selection and novel drivers of clonal hematopoiesis

Affiliations

Analysis of somatic mutations in whole blood from 200,618 individuals identifies pervasive positive selection and novel drivers of clonal hematopoiesis

Nicholas Bernstein et al. Nat Genet. 2024 Jun.

Abstract

Human aging is marked by the emergence of a tapestry of clonal expansions in dividing tissues, particularly evident in blood as clonal hematopoiesis (CH). CH, linked to cancer risk and aging-related phenotypes, often stems from somatic mutations in a set of established genes. However, the majority of clones lack known drivers. Here we infer gene-level positive selection in whole blood exomes from 200,618 individuals in UK Biobank. We identify 17 additional genes, ZBTB33, ZNF318, ZNF234, SPRED2, SH2B3, SRCAP, SIK3, SRSF1, CHEK2, CCDC115, CCL22, BAX, YLPM1, MYD88, MTA2, MAGEC3 and IGLL5, under positive selection at a population level, and validate this selection pattern in 10,837 whole genomes from single-cell-derived hematopoietic colonies. Clones with mutations in these genes grow in frequency and size with age, comparable to classical CH drivers. They correlate with heightened risk of infection, death and hematological malignancy, highlighting the significance of these additional genes in the aging process.


Conflict of interest statement

N.B. is an ex-employee of Calico Life Sciences LLC; R.L.C. and Z.C. are employees of Calico Life Sciences LLC. P.J.C. is a cofounder and shareholder of FL86 Inc. The other authors declare no competing interests.

Figures
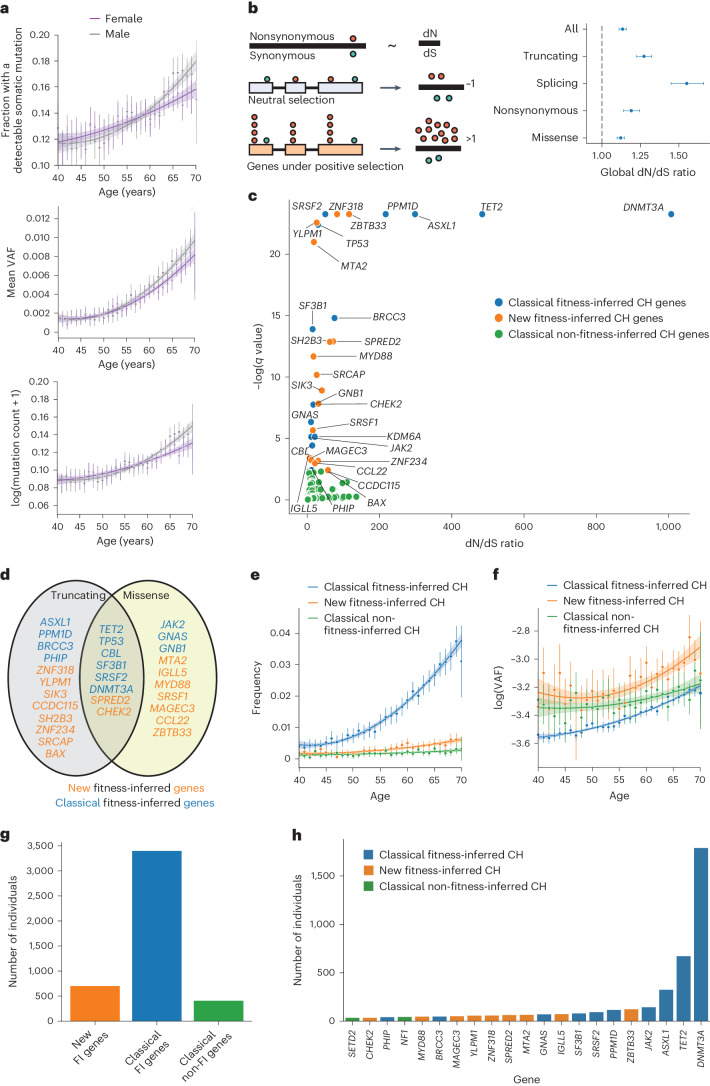
Fig. 1
Fig. 1. Pervasive selection in whole blood exomes in UKBB.
a, Exome-wide somatic mutation frequency, VAF and mutation counts in individuals increase with age. The error bars represent 2× standard error of the mean. The smoothed line represents a second-degree polynomial fit of the actual data, and the shading represents the CI. N = 200,618. b, Left: dN/dS is the normalized ratio of nonsynonymous to synonymous mutations. dN represents the rate of nonsynonymous mutations per nonsynonymous site, and dS represents the rate of synonymous mutations per synonymous site. A dN/dS of ~1 is expected under neutrality. Genes with a dN/dS ratio >1, taking into account a trinucleotide-specific mutation rate, indicates the gene is under positive selection (‘fitness inferred’, FI). HSCs with a mutation under positive selection will clonally expand to result in CH. Right: global positive selection in blood detectable at missense, essential splice site and truncating mutations (comprising nonsense substitutions and frameshift insertions/deletions). Nonsynonymous mutations comprise missense and nonsense single base substitutions. The error bars represent the 95% CI of the dN/dS parameter for that mutation type. N = 52,701 mutations. c, Classical fitness-inferred (FI) CH genes (in blue), Classical non-fitness-inferred (non-FI) genes (in green), and new fitness-inferred (FI) CH genes (in orange) representing both novel genes and several recently reported. The graph shows the dN/dS ratio for nonsense and/or missense variants >1, q value <0.1, plotting the maximum dN/dS value. d. New fitness-inferred CH genes (in orange) alongside classical fitness-inferred CH genes (in blue), and the types of nonsynonymous mutation they are under positive selection for. e,f, The frequency of individuals (e) and mutation log(VAF) (f) for new and classical FI CH genes and classical non-FI CH genes versus age. The error bars represent the 2× standard error of the mean. The smoothed line represents a second-degree polynomial fit of the actual data, and the shading represents the CI. N = 200,618 individuals. g, The number of individuals in UKBB with detectable somatic mutations in driver genes associated with CH. h, The number of individuals carrying CH conferring variants per gene. Source data
Fig. 2
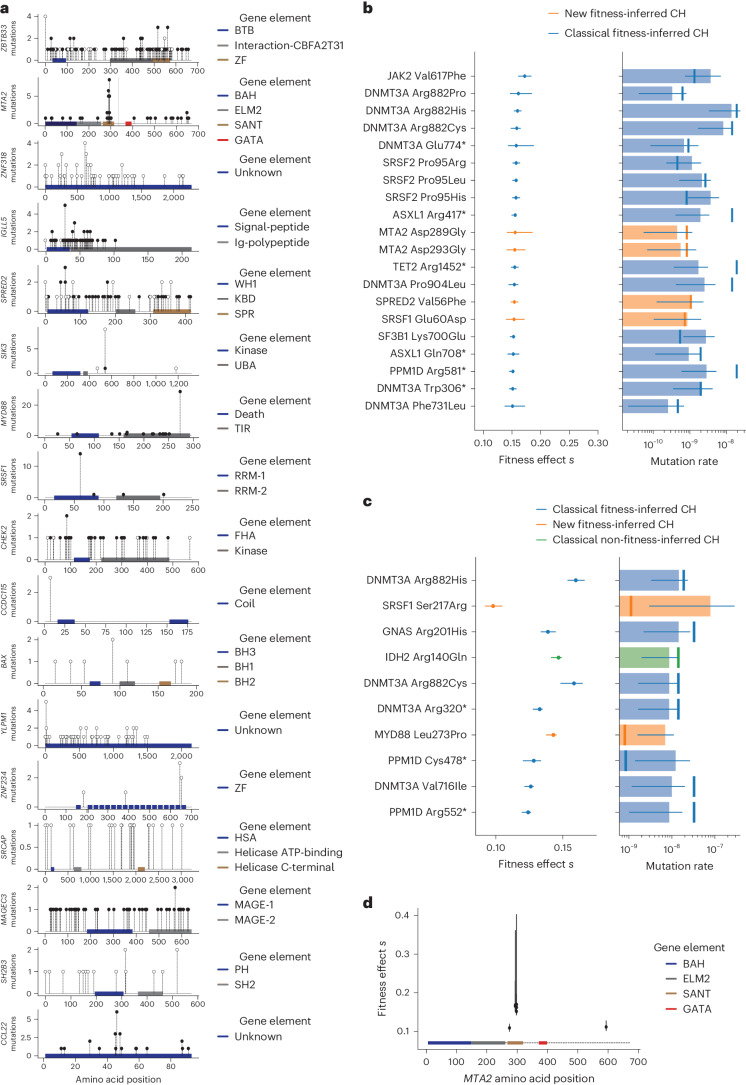
Fig. 2. New CH gene-specific mutation landscapes and fitness effects.
a, Location and type of mutation across the gene body for new drivers of CH. Filled black circles, missense mutations; filled white circles, truncating mutations (frameshift indel or nonsense mutations). b, Twenty-five recurrently mutated sites with the highest estimated fitness effects include several mutations in new CH driver genes. The error bars for the inferred fitness effect and mutation rate parameters are the CI. The number of observations of VAF for each mutation used to infer parameters is presented in Supplementary Table 4. c, Ten recurrently mutated sites with the highest estimated mutation rate. Of note, MYD88 Leu273Pro, which lies outside the SANT domain, has one of the highest mutation rates within the dataset but did not have a significantly increased fitness effect. The error bars for the inferred fitness effect and mutation rate parameters are the CI. The number of observations of VAF for each mutation used to infer parameters is presented in Supplementary Table 4. d, Fitness estimates for MTA2 plotted across the gene body, which primarily localize to the SANT domain. The error bars for the inferred fitness effect and mutation rate parameters are the CI. The number of observations of VAF for each mutation used to infer parameters is presented in Supplementary Table 4. Amino acid positions are colored by the gene elements shown in the key. Orange shading refers to new fitness-inferred genes of CH; classical fitness-inferred genes of CH are shown in blue, and classical non-fitness-inferred CH genes are shown in green.
Fig. 3
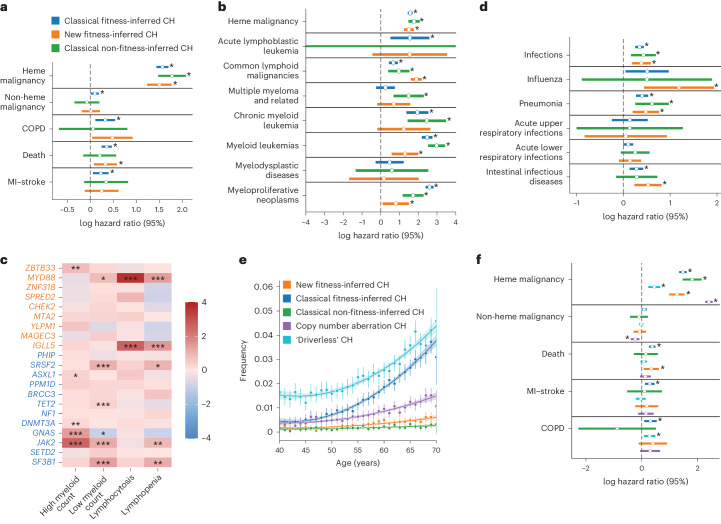
Fig. 3. Clinical outcome associations with new drivers of CH.
a,b,d, Cox-proportional HRs for a range of poor health outcomes against CH categories with CIs of log(HR) plotted. N = 200,618 individuals. Different categories of poor health outcomes are shown in a, hematological malignancies are shown in b, and infections are shown in d. *P < 0.05. Heme, hematological; COPD, chronic obstructive pulmonary disease; MI, myocardial infarct. c, Complete blood count associations of commonly mutated fitness-inferred driver genes. The stars are based on the FDR-adjusted P values from logistic regression (*P value >0.01 to <0.05, **P value >0.001 to <0.01, ***P value <0.001). e, The incidence of ‘driverless’ CH and autosomal mosaic copy number variants with age alongside other CH categories. The error bars represent the 2× standard error of the mean incidence. The smoothed line represents a second-degree polynomial fit of the actual data, and the shading represents the CI. N = 200,618 individuals. f, log(HR) with the 95% CI plotted for different categories of CH across poor health outcomes. N = 200,618 individuals. The orange shading refers to new fitness-inferred genes of CH, classical fitness-inferred genes of CH are shown in dark blue, classical non-fitness-inferred CH genes are shown in green, CH clones with copy number aberrations on autosomes are shown in purple, and CH clones without detectable candidate driver mutations are shown in light blue. Source data
Extended Data Fig. 1
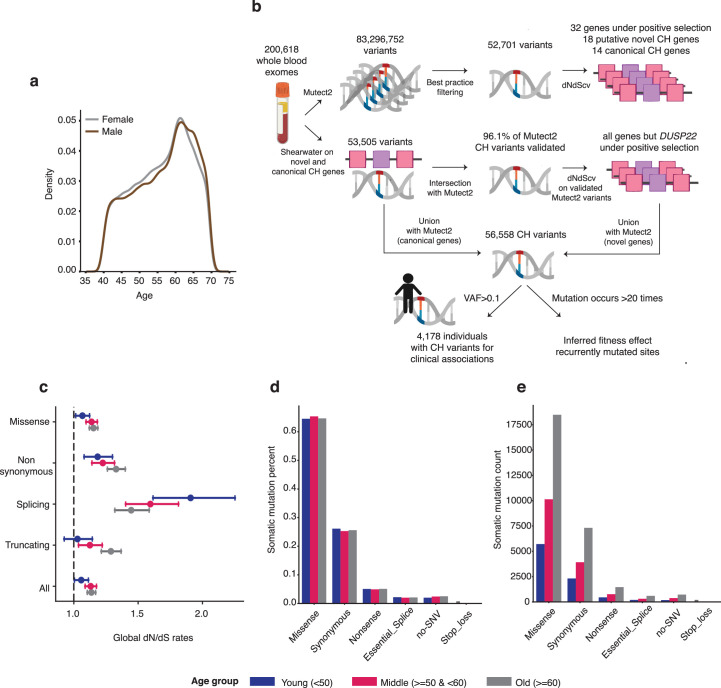
Extended Data Fig. 1. Variant calling, global selection and somatic mutations in UK Biobank.
a. Age distribution from UKBB. b. Pipeline for identifying exome wide selection on somatic mutations and new genes under positive selection in UKBB. c. Global dN/dS estimates per age group. Error bars represent the 95% CI of the dN/dS parameter for that mutation type and age group. N = 52,701 mutations. d. Percent of mutation type per age group. e. Number of mutations for each mutation type per age group.
Extended Data Fig. 2
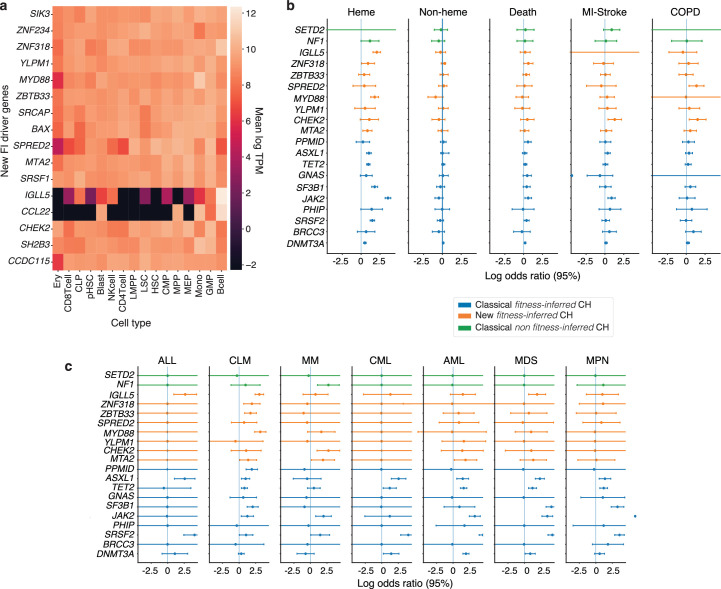
Extended Data Fig. 2. Gene expression and poor health outcome associations of recurrently mutated clonal haematopoiesis genes.
Gene expression of new ‘fitness-inferred’ (FI)-driver genes in haematopoietic compartment. Expression data was taken from Corces et al.. Common lymphoid progenitor, CLP; megakaryocyte-erythroid progenitor cell, MEP; common myeloid progenitor, CMP; granulocyte-macrophage progenitor cell, GMP; lymphoid-primed multipotent progenitor cell, LMPP; preleukemic HSC, pHSC; leukemia stem cells, LSC; erythroid cell, Ery; leukemic blast cell, blasts; multipotent progenitor cell, MPP; Mono, monocyte; NK cell, natural killer cell; HSC, haematopoietic stem cell. b, c. Logistic regression log odds ratios for a wide range of poor health outcomes for commonly mutated (genes with >35 mutations) driver genes of CH. Error bars represent the 95% CI. N = 200,618 individuals. Note the log odds ratio for JAK2 mutations and MPN is shown as ‘>’ as it is >5 (5.96, 95% CI 5.56–6.36). Acute lymphoblastic leukaemia, ALL; Common lymphoid malignancies, CLM; multiple myeloma and related, MM; chronic myeloid leukaemia, CML; acute myeloid leukaemia, AML; myelodysplastic diseases, MDS; myeloproliferative neoplasms, MPN; acute upper respiratory infection, AURI; acute lower respiratory infection, ALRI; intestinal infections, II. Orange shading refers to new FI genes of CH; classical FI genes of CH are shown in blue, and classical non FI CH genes are shown in green. Source data
Extended Data Fig. 3
Extended Data Fig. 3. Clone size effect on poor health outcomes.
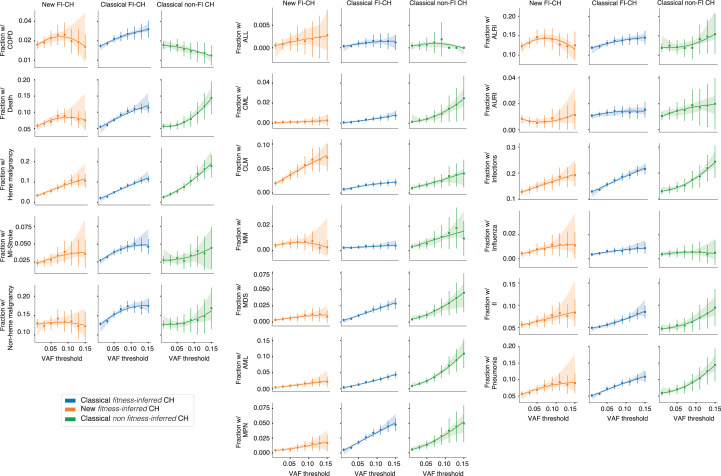
Clone size effect on poor-health outcomes (malignancy, stroke, death, different haematological neoplasms and infections) incidence by CH driver mutation category. Poor health outcomes incidence increases as clone variant allele frequency increases to 0.1 after which the relationship becomes unstable which has been noted previously for DNMT3A and TET2 mutant clones and cardiovascular risk. Error bars represent the 2*standard error of the mean incidence. The smoothed line represents a second degree polynomial fit of the actual data and the shading represents the 95% CI. N = 200,618 individuals. Orange shading refers to new FI genes of CH; classical FI genes of CH are shown in blue, and classical non FI CH genes are shown in green. Source data

References

    1. Colom B, et al. Spatial competition shapes the dynamic mutational landscape of normal esophageal epithelium. Nat. Genet. 2020;52:604–614. - PMC - PubMed
    1. Lee-Six H, et al. Population dynamics of normal human blood inferred from somatic mutations. Nature. 2018;561:473–478. - PMC - PubMed
    1. Olafsson S, et al. Somatic evolution in non-neoplastic IBD-affected colon. Cell. 2020;182:672–684.e11. - PMC - PubMed
    1. Yizhak K, et al. RNA sequence analysis reveals macroscopic somatic clonal expansion across normal tissues. Science. 2019;364:eaaw0726. - PMC - PubMed
    1. Martincorena I, et al. Tumor evolution. High burden and pervasive positive selection of somatic mutations in normal human skin. Science. 2015;348:880–886. - PMC - PubMed